Some "Historical" Time Series Data Sets
The forecasting performances of (i) Box-Jenkins ARIMA models, (ii) Bilinear models, and (iii) SETAR models were evaluated on the basis of ten Indian economic time series by D. Ray (1988). Comparison of forecasts: An empirical investigation. Sankhya B, Vol. 55, 258-277 (Paper). The data set is here; see also report-ae-6-98.pdf by De Bruin and De Gooijer (1998).
Franses and De Bruin (2002, Computational Statistics & Data Analysis) examine nonlinear features in 64 monthly and 53 quarterly US macroeconomic variables for a range of Box-Cox data transformations. For a small subset of 10 US (un)-employment series, diagnosed to be non-linear for all Box-Cox parameter values in the range [0,1], De Bruin and Franses (1999, J. of Applied Statistics) evaluate the forecasts from a non-linear time series model.
For high-dimensional time series analysis and prediction, we recommend to visit the Kaggle website. The site offers a huge repository of community published data sets and codes.
Some more macroeconomic time series:
- The Grilli-Yang (GY) commodity prices index is one the most widely used commodity price series in the applied economics literature.The Winzip file includes the original data set and an updated version. There is also a reference to a paper analyzing the data set by STAR models.
- The homepage of Mark W. Watson provides GAUSS codes and data files. This material can be used to replicate results in some of his papers. One interesting data set, the monthly US job vacancy rates, is here; see also the paper by Lundbergh et al. (2003, J. of Business & Economic Statistics).
- FRED-MD and FRED-QD are monthly and quarterly macroeconomic databases designed for the empirical analysis of "big data". The website Resources for Economists on the Internet (RFE) offers links to sites with data and computer code from economic journals as well as replication studies; see also here.
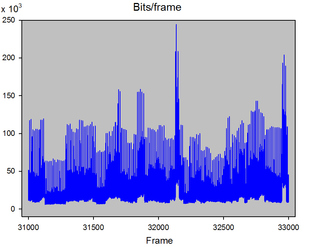
In Broadband Integrated Services Digital Networks (B-ISDNs), a major part of the traffic is produced by multimedia sources like teleconferencing and video-on-demand servers. Most of the video-encoding in these networks is based on the MPEG (Moving Picture Experts Group) standard. To better understand the characteristics of MPEG video traffic and their impact on network performance, various linear and nonlinear time series models have been developed. In particular, these models are suitable for modeling variable bit rate (VBR) encoded video. A key paper in this area is by Jang and Thompson (1998). Threshold autoregressive models for VBR MPEG video traces. INFOCOM'98 7th Annual Joint Conference of the IEEE Computer and Communications Societies, Proceedings IEEE (Vol. 1); see the file video-data.zip for the paper and data for the full-motion video "James Bond: Goldfinger". Click on the following link to get access to information on the statistical analysis of MPEG files. The Bellcore Star Wars data set is another typical example.
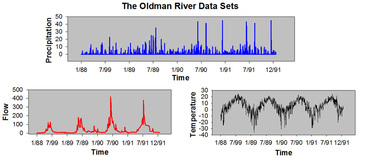
Hydrologists have long recognized the nonlinear relationships between hydrological and meteorological variables associated with streamflows. It is well known that in drainage systems where precipitation alternates between rainfall and snowfall, temperature during late winter and early spring plays an important nonlinear role in streamflow generation. Another departure from linearity is caused by the amount of soil moisture. Its major effect is to relate rainfall and streamflow nonlinearity. The papers by Astatkie and Watt (1998, Water Resources Research) and Astatkie, Watt and Watts (1996, Nordic Hydrology) apply NeTAR-type models to three Canadian streamflow systems.
Appendix 3 in the book by H. Tong (1990), Non-linear Time Series: A Dynamical System Approach (Oxford: Oxford University Press), contains the following "classical" nonlinear time series.
To access Howell Tong's published papers, please visit Wikipedia and enter ``Howell Tong, nonlinear time series". Scroll down to “External links” and click “Published papers and A conversation with Howell Tong”.
- Lynx data; see also the R-timsac and R-tsDyn packages for the data.
- Annual mean sunspot numbers Note, since July 2015 the original Sunspot number data are replaced by a new entirely revised data series, and available for downloading at www.sidc.be/silso/datafiles.
- Blow-fly data (approximately 2 years of bi-daily laboratory data; 5 series); see also readme-blowfly.txt.
- Icelandic river flow system.
- Dissolved oxygen data (Beach water quality) (4 series).
- Medical data (2 series).
- Respiration data (1 series).
- Stock price data (3 series).
To access Howell Tong's published papers, please visit Wikipedia and enter ``Howell Tong, nonlinear time series". Scroll down to “External links” and click “Published papers and A conversation with Howell Tong”.
Two additional external software and data resources (New):
- PhysioNet. An online collection of recorded physiological signals and software . Provides robust implementations of many entropic calculations in addition to code for multifractal analysis using the wavelet formalism.
- LYSIS. A collection of executable packages for nonlinear system identification. Similar to TISEAN (an excellent collection of nonlinear time series analysis tools with a focus on nonlinear dynamics), appropriate adapter software was written for interfacing with MATLAB.